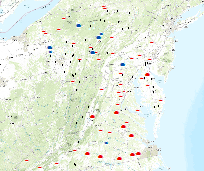
Changes in Stream Water Temperatures in the Chesapeake Bay Region, 1960-2014
Access & Use Information
Downloads & Resources
Dates
| Metadata Date | November 20, 2019 |
|---|---|
| Metadata Created Date | March 22, 2024 |
| Metadata Updated Date | March 22, 2024 |
| Reference Date(s) | August 2, 2016 (publication) |
| Frequency Of Update | annually |
Metadata Source
- ISO-19139 ISO-19139 Metadata
Harvested from Environmental Dataset Gateway ISO Geospatial Metadata
Graphic Preview

Additional Metadata
| Resource Type | Dataset |
|---|---|
| Metadata Date | November 20, 2019 |
| Metadata Created Date | March 22, 2024 |
| Metadata Updated Date | March 22, 2024 |
| Reference Date(s) | August 2, 2016 (publication) |
| Responsible Party | U.S. Environmental Protection Agency, Office of Air and Radiation (Publisher) |
| Contact Email | |
| Guid | E3CB0878-2DAD-4783-BA92-0B3049FF13DF |
| Access Constraints | https://edg.epa.gov/EPA_Data_License.html |
| Bbox East Long | -75.117 |
| Bbox North Lat | 41.997 |
| Bbox South Lat | 36.717 |
| Bbox West Long | -82.296 |
| Coupled Resource | |
| Frequency Of Update | annually |
| Graphic Preview Description | Change in stream temperature |
| Graphic Preview File | https://edg.epa.gov/data/PUBLIC/OAR/OAP/metadata/Thumbnails/StreamTemperature.png |
| Graphic Preview Type | PNG |
| Harvest Object Id | 41a563c2-58ea-4c2f-b88c-af5453cf5b73 |
| Harvest Source Id | 9b3cd81e-5515-4bb7-ad3c-5ae44de9b4bd |
| Harvest Source Title | Environmental Dataset Gateway ISO Geospatial Metadata |
| Licence | None. Please check sources, scale, accuracy, currency and other available information. Please confirm that you are using the most recent copy of both data and metadata. Acknowledgement of the EPA would be appreciated. |
| Lineage | |
| Metadata Language | eng |
| Metadata Type | geospatial |
| Old Spatial | {"type": "Polygon", "coordinates": [[[-82.296, 36.717], [-75.117, 36.717], [-75.117, 41.997], [-82.296, 41.997], [-82.296, 36.717]]]} |
| Progress | completed |
| Spatial Data Service Type | |
| Spatial Reference System | 102010 |
| Spatial Harvester | True |
| Temporal Extent Begin | 1960-01-01 |
| Temporal Extent End | 2014-01-01 |
Didn't find what you're looking for? Suggest a dataset here.

